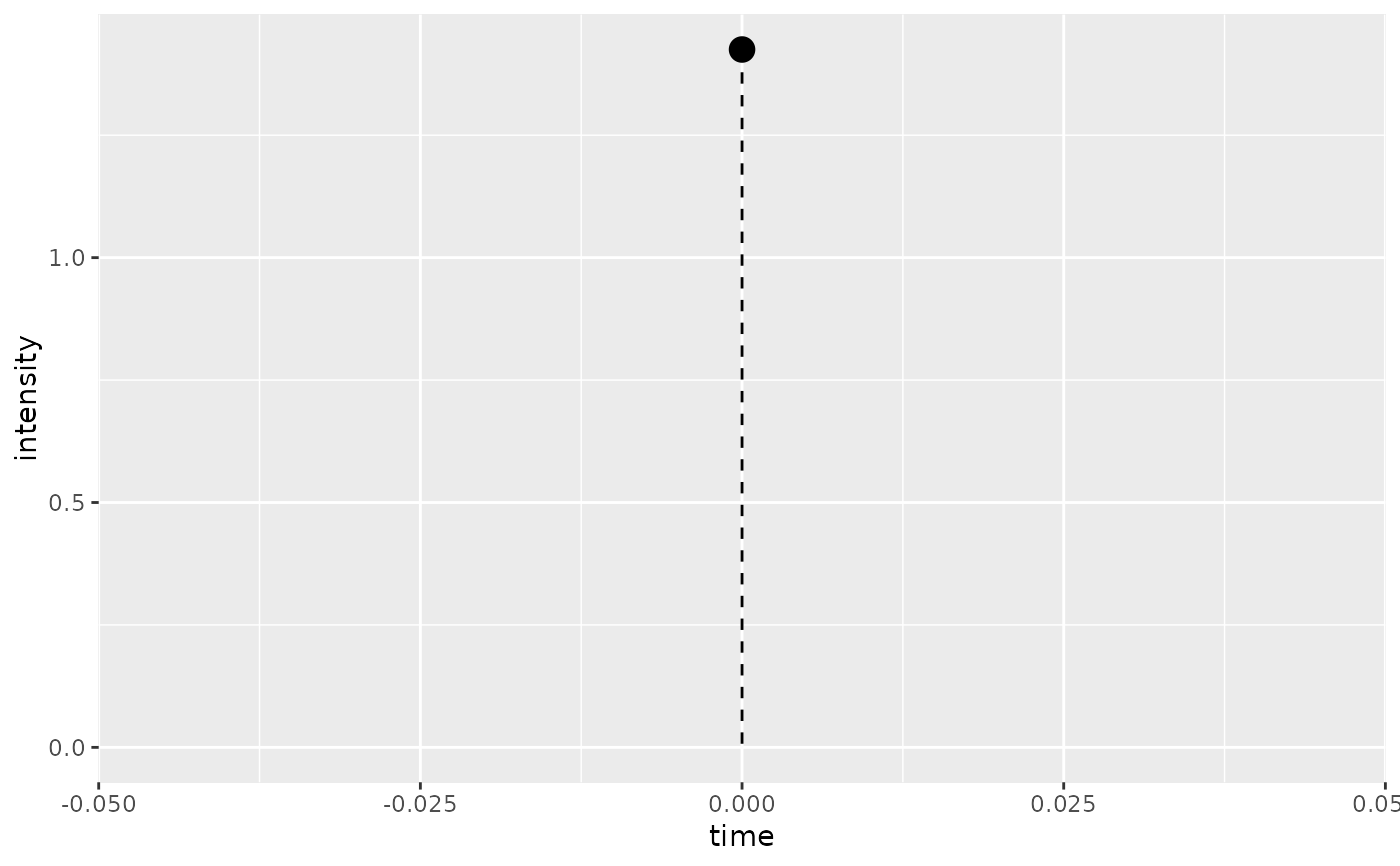
Plot a Hawkes process and its intensity function
plot_event_series.RdPlot a Hawkes process and its intensity function
plot_event_series(model, cascade = NULL, cascade_index = 1)
Arguments
| model | A model object where data, model_type and par are required |
|---|---|
| cascade | This cascade data.frame will be used if provided |
| cascade_index | Determine which cascade in the list of cascades to plot default to the first cascade |
Value
A ggplot object
Examples
par <- c(K = 0.95, theta = 1)
data <- generate_series(model_type = 'EXP',
                                     par = par,
                                     sim_no = 1, Tmax = Inf)
plot_event_series(new_hawkes(model_type = 'EXP',
                             par = par,
                             data = data))