birdspotter: A toolkit for analyzing and labelling Twitter users
Social media platforms, although relatively new, host millions of users and billions of interactions daily. As tied as we are to these platforms, they profoundly impact our social institutions through phenomena such as disinformation, political polarization, and social bots.
Researchers are increasingly interested in trying to form an understanding of phenomena and their implications. Social scientists, political scientists, and data practitioners alike curate expansive datasets to combat these potentially adverse effects on our society; however, they lack the appropriate tooling.
birdspotter is an easy-to-use tool that models Twitter users’ attributes and labels them. It comes prepackaged with a state-of-the-art bot detector and an influence quantification system based on tweet dynamics. birdspotter features a generalized user labeler, which can be retrained easily with the engineered features to address a variety of use cases. Also, birdspotter.ml is a web application that can be utilized to explore datasets and derive a narrative around a dataset.
In this post, I’ll showcase the basic usage of birdspotter and birdspotter.ml.
Installation
The package can be installed in the canonical python way:
pip install birdspotter
Getting a dataset
The Twitter T&Cs restrict the sharing of tweet data directly online; however, they do allow the sharing of tweet-ids, which can be converted to full tweet data through a process called hydration. Tools like twarc can be used to hydrate a Tweet ID dataset. The resulting dataset will be in jsonl (line delimited json) format, which birdspotter accepts directly.
In the below examples, we use two datasets; a collection of COVID-19 related tweets from January 31st, 2020 [1], and a collection of tweets about politicians on Twitter [2].
The politicians’ dataset was acquired through the following process (and a similar process was taken for the COVID-19 dataset):
pip install twarc
wget http://twitterpoliticians.org./downloads/base/all_tweet_ids.csv
twarc hydrate all_tweet_ids.csv > tweets.jsonl
Basic Usage
The code below imports the main class Birdspotter, extracts the tweets from their standard format, labels the users with the default bot detector and influence, and reformats the retweet cascades into a tidier format.
## Import birdspotter
from birdspotter import BirdSpotter

## Extracts the tweets from the raw jsonl [https://github.com/echen102/COVID-19-TweetIDs]
bs = BirdSpotter('covid19.jsonl')

## Uses the default bot labeller and influence quantification systems
bs.getLabeledUsers()

## Formats the retweet cascades, such that expected retweet structures can extracted
bs.getCascadesDataFrame()

## Access the botness labels and influence scores
bs.featureDataframe[['botness', 'influence']]
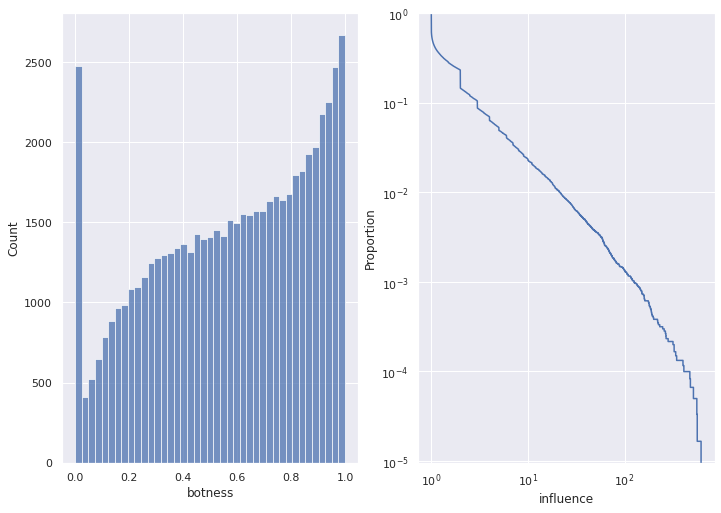
From here, the dataset is readily profile-able:
botness_dist = sns.histplot(data=bs.featureDataframe, x="botness")
influence_eccdf = sns.ecdfplot(data=bs.featureDataframe, x="influence", complementary=True).set(xscale="log", yscale="log")
The visualizer
An alternative way to profile a dataset is the use birdspotter.ml, which facilitates dataset exploration and narrative construction.
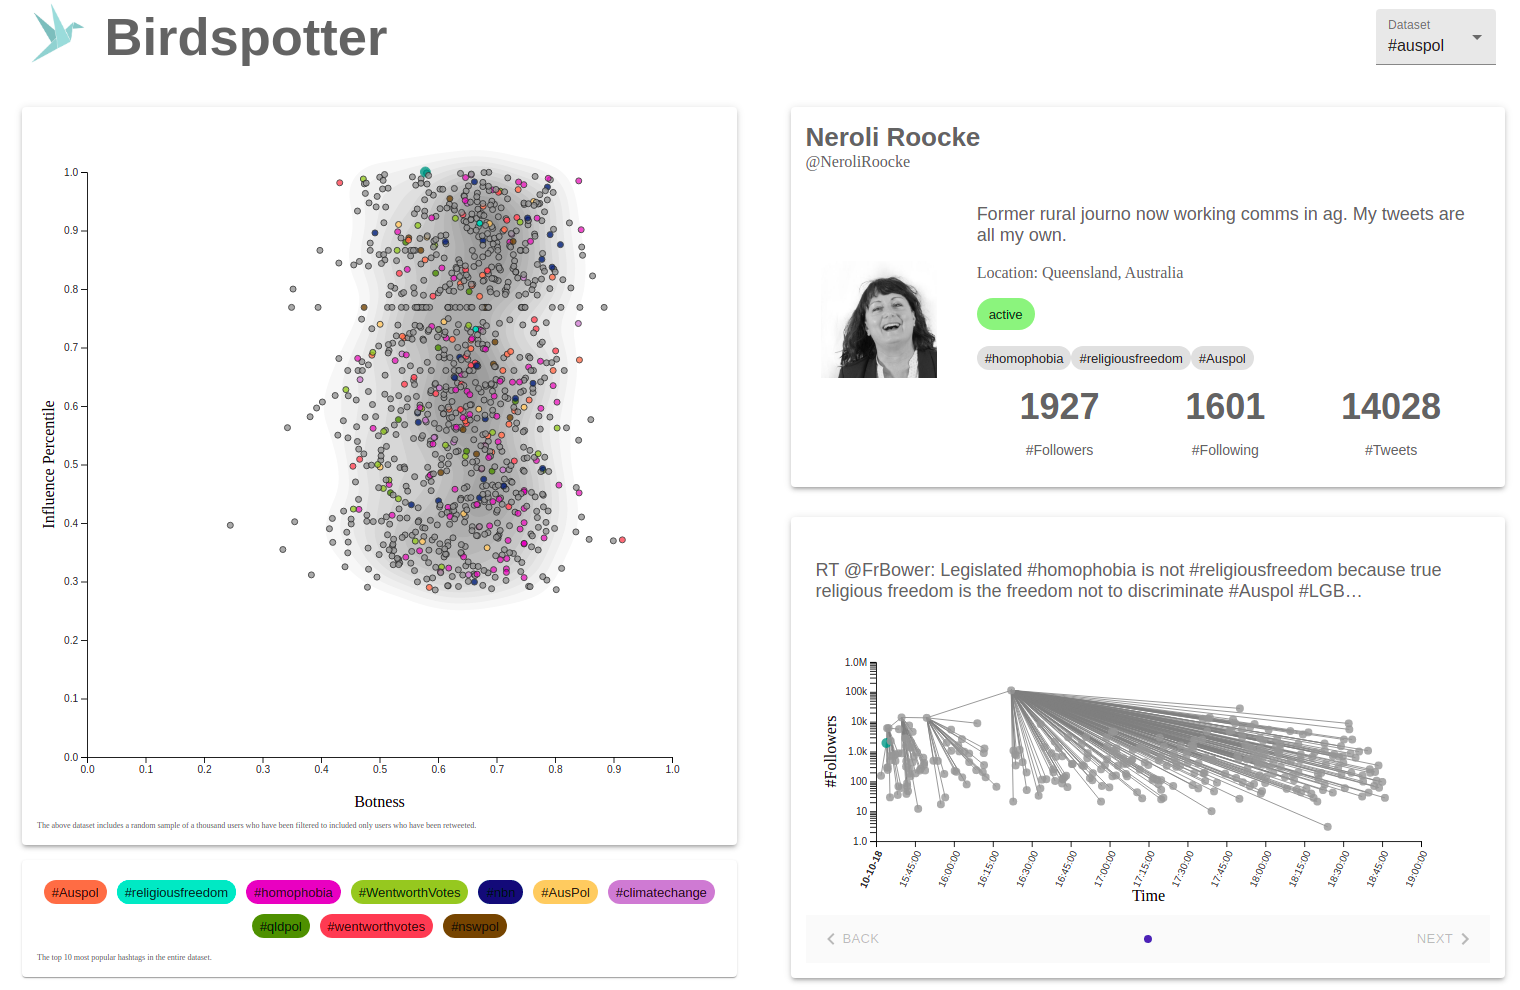
The visualizer features a scatterplot (on the left) of influence and botness for a sample of users and the population density. The colors represent the hashtags (a proxy for the topic) that the users most tweet about in the dataset. Users within the scatterplot are hoverable and selectable, and their information populates in the components on the right.
The top right component shows information and metrics about the selected user and links the user’s profile.
The bottom right component shows the retweet cascades where a user has participated and highlights their participation. The points represent the follower counts (social capital) of users and their retweets/tweets’ timing. The points are also hoverable and selectable.
Customising the labeller
By default, the labeler is trained as a bot detection system, comparable to the state-of-the-art botometer. Notable, birdspotter is provided in an offline package and can be applied at scale, while botometer is accessible only via an online API, which is often prohibitively rate-limited.
birdspotter is a versatile tool and can be utilized by practitioners for a variety of use-cases. For example, we could train the labeler to identify political leaning. This process is a bit involved, so we summarise it below;
- We hydrate some tweets from the Twitter Parlimentarian Database
- We filter the tweets to include only Australian Politicians.
- We label right-wing partied politicians positively, and others negatively (with
bs_pol.getBotAnnotationTemplatefor example) - We retrain
birdspotterwith these new labels and label all users (i.e., including users the politicians retweeted) using the new model
bs_pol = BirdSpotter('aus_tweets.jsonl')
bs_pol.trainClassifierModel('pol_training_data.pickle')
bs_pol.getLabeledUsers()
On this limited of Australian politicians dataset, a 10-fold CV of birdspotter garners an average AUC (Area under ROC) of 0.986.
Conclusion
birdspotter aims to democratize social analyzes that were once the domain of machine learning experts, generating insights and understanding of online phenomena and mitigating their potentially adverse effects on our society. This post shows how birdspotter can be used in both a simple and advanced way to recover such insights.
References
[1] Chen, E. et al. 2020. Tracking social media discourse about the covid-19 pandemic: Development of a public coronavirus twitter data set. JMIR Public Health and Surveillance. 6, 2 (2020), e19273.
[2] Vliet, L. van et al. 2020. The twitter parliamentarian database: Analyzing twitter politics across 26 countries. PloS one. 15, 9 (2020), e0237073.